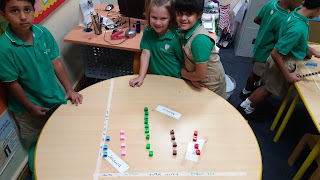
We learnt how to create a bar chart using information from our tally chart.
We used rulers to make straight x and y axes.
We learnt how to create intervals of the same size.
We made sure our charts were accurate.
We worked well in teams.
WE HAD FUN!!


No comments:
Post a Comment